The MacArthur Transit Village was prominent in Oakland housing news in the first few months of this year. For those who don’t know, the MacArthur Transit Village is a large multifamily development between the City of Oakland, BART, for-profit and non-profit affordable housing developers on the former site of a parking lot next to the MacArthur BART station. The plans are big: 875 new units (including 146 affordable) with tens of thousands of square feet of non-residential ground-floor space. In general, it’s great news!
I thought now—a few months after the developer received final entitlements—would be a good time to reflect on some of what I learned from the development process. As part of a research methods course in the Masters of City Planning program, a few of my classmates and I wrote a paper about the project, which you can find here.
1. There’s a surprising amount of community support for housing in Oakland
I tend to consider people like me—pro-development urbanist nerds that celebrate density—an outlier. However, that’s not what I saw at the city meetings for the MacArthur Transit Village. If anything, two-thirds of the crowd was supportive of the project and cited the kinds of arguments—from the environmental benefits of transit-oriented housing to the need to increase housing supply at all ends of the market and increased property tax revenue, etc.— that you would hear in a city planning program. The supporters groups were a spectrum ranging from YIMBY activist groups (props to East Bay Forward), labor union members, to longtime area residents. Although these groups certainly have their differences, they each coalesced in support of the project for good reasons. Contrary to what I thought before the meetings, it isn’t just urbanist twitter arguing for smart, transit-oriented infill housing.
A few of my classmates and I wanted to survey neighborhood residents outside of the active community members present at the city meetings. In order to do this, we intercepted approximately 150 community members at intersections around the MacArthur BART station. Although this was in no way a random sampling of neighborhood residents, I think we learned some interesting things. For those who had heard of the project (about half), we asked if they supported or opposed the development. 24 supported the project, while 18 opposed. This sort of evidence, combined with the support I heard at the city meetings, gives me hope for future coalition building around a pro-development housing agenda. YIMBYs certainly leave out some important nuance from the discussion, and the views of other left-leaning housing activists and neighborhood residents could greatly contribute to a fuller, more formidable housing alliance—something that Jordan Fraade and Daniel Kay Hertz have discussed recently.
2. There is a disconnect between community needs and developer exactions
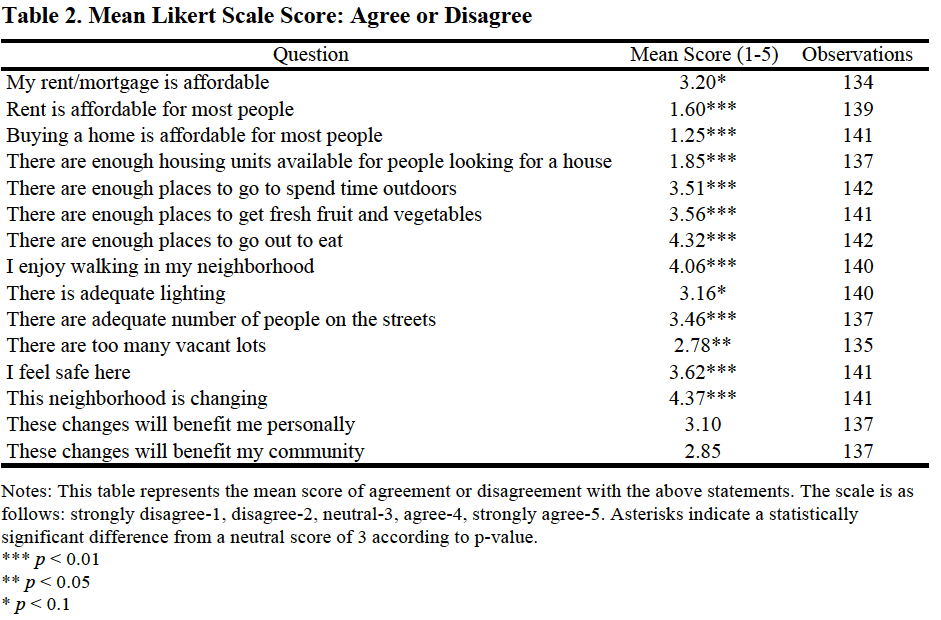
Our surveys showed that there was an apparent disconnect between what residents rated as the greatest community concerns and the exactions that the city is demanding from the transit village developers. As the table below shows, the community seems to clearly identify affordable housing availability as the greatest community problem. However, in the development agreement the city is demanding contributions for parks and other miscellaneous capital improvement projects in exchange for a density bonus. These are improvements that could instead likely come from the general tax revenue additions from the project. Instead, the city could use exactions in the development agreement as contributions to the city’s affordable housing fund or to more below-market rate units in the area. The exactions are not a lot, but every little bit helps. This is something that the city is struggling with in aggregate as well, and Oakland as a whole might be well suited to focusing developer exactions on subsidizing below market rate units.
3. Differences in project awareness is a possible culprit for this disconnect
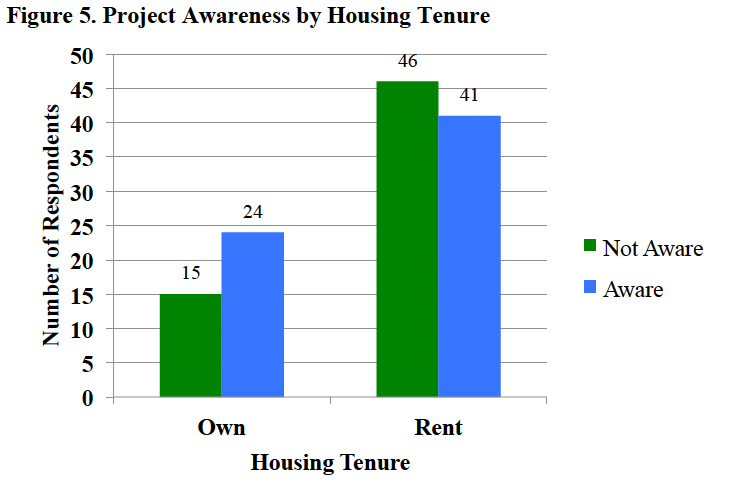
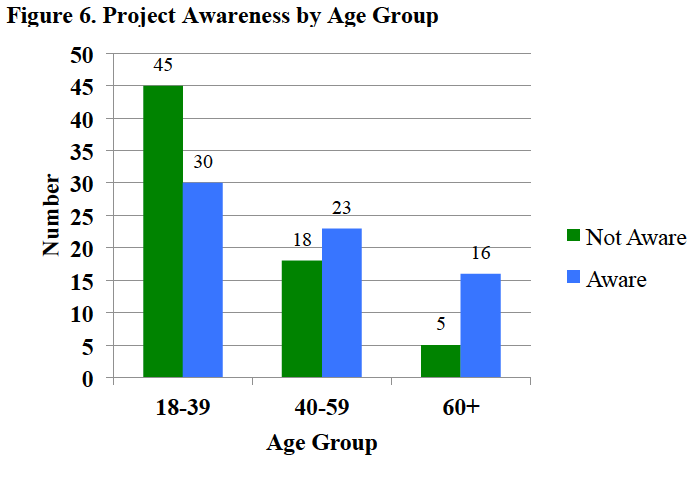
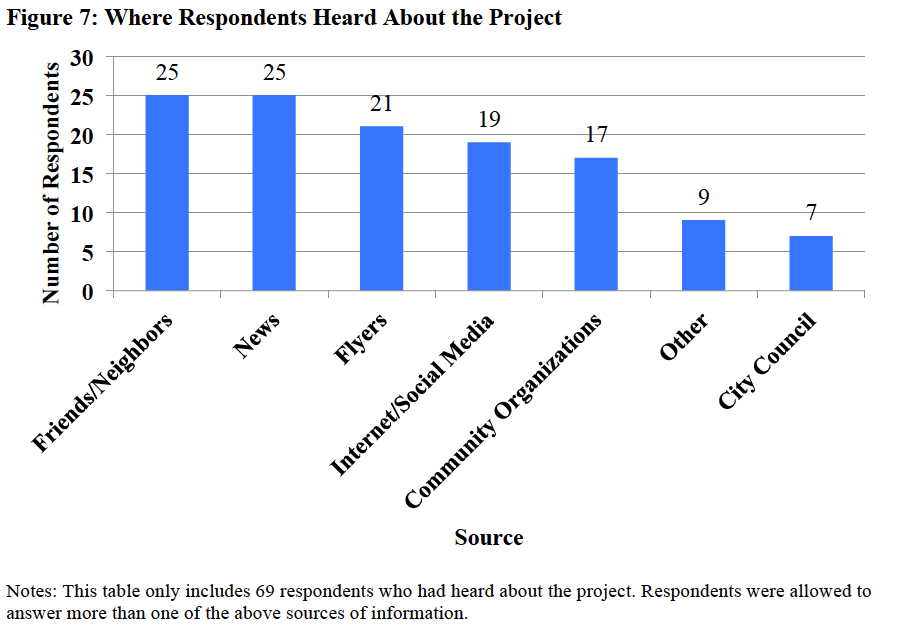
Another interesting finding from our survey were differences in project awareness among age and housing tenure, shown in the figures below. Also, as Figure 7 below shows, residents who were familiar with the project were far more likely to have heard of the project via informal community associations rather than the city itself. In general, it seems like older homeowners were more likely to be aware of the project, and these residents were most likely to hear about the project from their neighbors or the news rather than the city itself.
Prior to the city’s meetings to decide the fate of the transit village, the only community outreach was in voluntary community meetings hosted by the developer or the local city councilor. Older homeowners tend to be the residents with the most social capital to hear about these meetings and thus, are best positioned to influence the negotiation process with the developer. While this is of course speculation, I’d bet that this same group would be more likely to support expenditures on parks, streets, and other miscellaneous amenities rather than affordable housing. Instead, a more comprehensive neighborhood survey would likely have given a better sense of the true neighborhood priority—housing. While I don’t know the practical solution to this problem, there’s a lesson here for planners about how we reach out to neighborhood groups. In particular, there’s definitely a place for more objective information gathering about neighborhood needs.
A little late on this, but the SF Planning Department released the latest release of its Development Pipeline series sometime over the winter holidays.
I have created a nice map of the residential developments from this data here. When filtering the data, the “All Proposed” data will show the Q3-2016 data. In sum, this is the latest snapshot of development activity happening in the city.
In addition to including all proposed developments, users can filter the data by 7 categories based on the latest status of the project: Under construction, building permit issued, building permit reinstated, building permit approved, building permit filed, planning department application filed, and planning department application filed. In general, the development process proceeds as follows: Planning department approval –> building permit approval –> Construction.
The current snapshot represents roughly what we have seen in the past: a relatively high amount of development in the eastern half of the city, especially around the Market Street corridor. By contrast, the western half of the city has little to no consequential development, aside from the Parkmerced megaproject.
Some logistical notes:
Also included in the map are developments from previous releases that have been completed. Developments leave the pipeline when they are granted a final “certificate of completion” from the Department of Building Inspection. While, in most cases this pinpoints the quarter of completion, it is not a perfect method.
San Francisco’s housing crisis is no secret. As perhaps the biggest city planning issue in the Bay Area, activists from all over the region—neighborhood organizations, planning professionals, NIMBYs, and YIMBYs—have fiercely debated and fought over new housing, development by development. Yet for all of the concerns and passion surrounding the issue, it is surprisingly difficult to find data on where, when, and by how much housing is being produced within the city.
In this long-form post, I try to bring this information to life from the data annals of the SF Planning Department. To preview what’s below, I explore patterns of housing production within San Francisco—where, and by how much has housing increased in the past few years? Next, I combine this data with neighborhood rent patterns from Zillow to explore how this production might relate to housing affordability.
Context
San Francisco has been producing tens of thousands of new jobs while typically only adding between two to four thousand new housing units each year (Moretti 2013). By the laws of supply and demand, this has naturally led to a shortage of affordable housing. This is not just a problem that affects the poor. Some economists have estimated that if metropolitan areas increased housing supply with outside worker demand, U.S. GDP could by as much as 9.7% (Chang-Tai and Moretti 2015).
Governments recognize that this is an issue. As part of the state-mandated Regional Housing Need Allocation (RHNA) process, the Association of Bay Area Governments (ABAG) has targeted San Francisco to provide 28,869 additional units of housing between 2014 and 2022 (ABAG 2014, p. 24). As we will see shortly with the maps of recent production in the past 3 ½ years, current production is roughly on track to achieve this goal. At the beginning of 2014, San Francisco had an estimated 379,597 units, so meeting the RHNA goals would represent about an 8% increase in housing (SFPD 2015, p. 5).
The Development Process
Note that the RHNA goals are not binding. Instead, this just means that San Francisco has to plan to accommodate this much housing by providing favorable zoning and funding to support these goals. Ultimately, meeting housing demand is up to the market. Although the development process is endlessly complex, I will spare my readers the gory details in exchange for some key points to understand the maps below.
There are two parallel permitting tracks: building permitting and planning permitting (entitlement). While the former ensures that a building meets building standards, the latter makes sure that it conforms to the land use zoning regulations. After construction, the Departments of Building Inspection looks over the development one more time and issues a Certificate of Final Completion, which is when I mark developments as completed in the maps below. With all this red tape, the median time from submission of first proposals to completion is typically 3 ½ years (“SFPD 2014, p. 15).
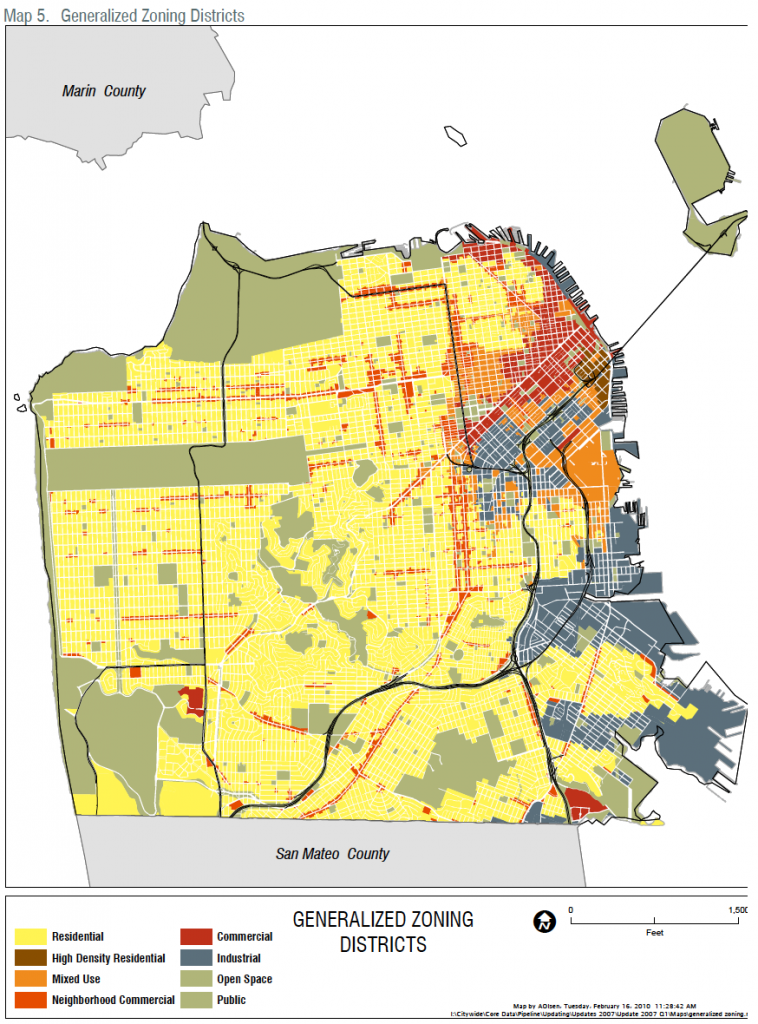
All this is to say that there is no getting around the zoning code. If there is any hope for a variance, developers usually need the support of the community, which typically decries any project out of scale with the ‘character’ of nearby development (Dineen 2016). These facts, combined with the map below of the zoning code, foreshadow a result that we can see in the interactive maps: highly concentrated development in the few places that it is allowed.
Figure 1. – SF Zoning Code 2014Notes: This map is a simplified version of the SF zoning code 2014. It shows that the majority of zones in San Francisco are low-density residential (in yellow). By contrast, only a small portion of the city allows for high-density mixed-use development (orange or brown). Source: SF Development Pipeline Report Q3 2014.
Map of Residential Projects
The interactive map below allows users to click on the dots to see more details about each development. I have also linked the data with the Google Maps Javascript API for street view panoramas. Hopefully this can give users a sense of the neighborhood for each development. Furthermore, the map allows users to switch between recently completed projects and currently proposed projects. The map for recently completed projects shows residential completions in San Francisco from the SF Planning Department’s Development Pipeline Data. This data tracks residential completions between Q4 2012 – Q1 2016 (the only period for which there is consecutive data). The first thing that stands out to me is that the total number of projects seem fairly spread out. Despite this, it is clear that large recent developments have been concentrated in certain areas. In particular, the Market Street Corridor, SoMa, and the Dogpatch appear to have particularly high levels of development.
As for currently proposed developments, these appear to be a bit more dispersed but with the same general trends. Note that there are more dots for the currently proposed data because this includes all projects currently in the development pipeline, no matter how long the time horizon. This data includes all projects that currently have applications on file with either the planning department or the Department of Building Inspection and so they span from planning permits that have just recently been filed to construction. Furthermore, this map assumes that all projects will be brought to completion, which overstates what will actually be built. However, this map is probably a realistic prediction of what future development will look like on average.
Map by Neighborhood
The dot maps suggest that large residential development are concentrated, but in order to get a better sense of this concentration, I have aggregated units built with a polygon map. Because I will shortly examine development’s impact on neighborhood affordability, I use neighborhood boundaries from Zillow for this aggregation.
While not totally unexpected, it is startling to see how concentrated development is. Out of the 13,950 net units added over this time period, about half of these come from one neighborhood: SoMa. Furthermore, the top five neighborhoods—SoMa, the Financial District, Downton, the Western Addition, and Bayview—comprise 11,933 net units, or 86% of that total. By contrast, large areas in the western part of the city, such as Richmond or the Sunset District, have added less than 50 units each.
Although the housing supply is growing with demand, not every area of the city is sharing this burden. It’s important to point out that this is due to deliberate zoning decisions made by the planning department in the past 10 years. However, behind every planning decision is tremendous political pressure from neighborhood associations and the like. We can probably trace this development back to NIMBYism.
Impacts on Neighborhood Affordability
As an example of a research question that can use this data, I have merged the map data with Zillow’s neighborhood-level median rent index.[1] Has increased housing supply helped stem rising rents in neighborhoods with a large amount of residential development? Or could it actually have led to increasing rents? Contrary to basic microeconomic theory, some claim that increased development at a local level can actually increase rents due to positive externalities from property value improvements.
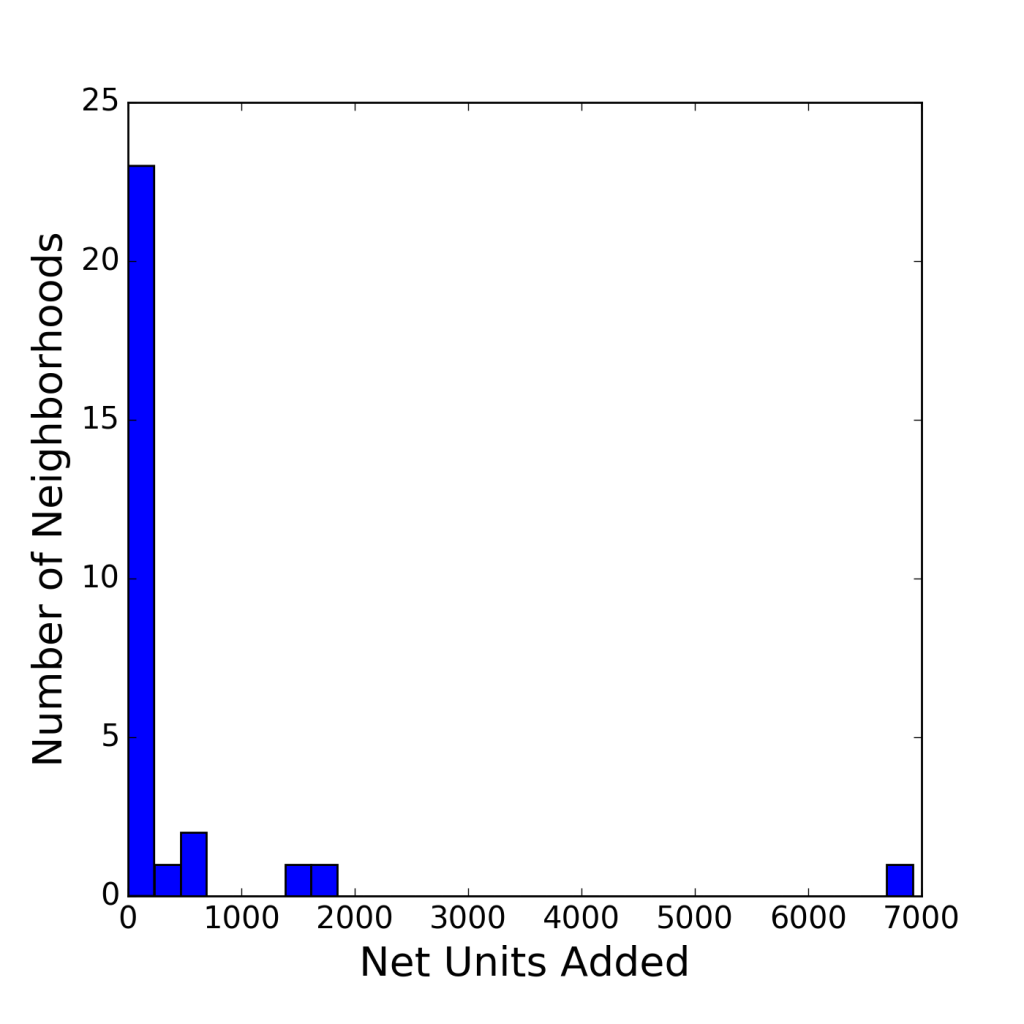
First, I examine data on recent units built between Q4 2012 and Q1 2016 and rent change over that same period in histograms. The first histogram reveals the truly extreme nature of the outliers. First, the figure shows that the overwhelming majority of neighborhoods added less than 200 or so units. Second, there is a small middle group that added between 500 and about 2000 units. Finally, there is SoMa in a class of its own.
Figure 2. – SF Units Added by NeighborhoodNotes: Figure shows amount of neighborhoods by number of units added over the span of Q4 2012 to Q1 2016
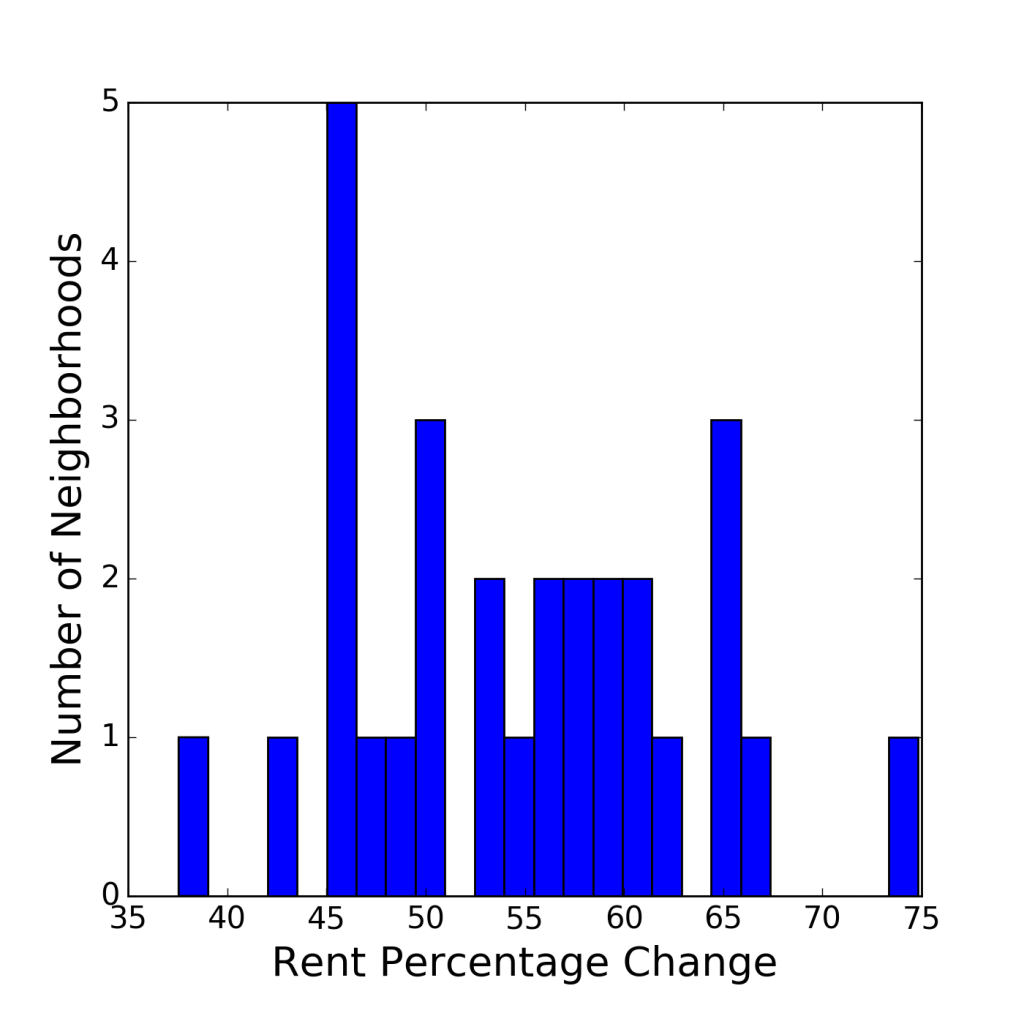
The second histogram shows that despite the high concentration of development, rent change is fairly evenly distributed across the neighborhoods. In good news for proponents of economic theory, two of the 5 neighborhoods with the lowest percentage increase in median rent—SoMA and the Western Addition—were also in the top 5 in units produced. However, the other 3—the Twin Peaks, North Beach, and Parkside—all added less than 100 units.
Figure 3. – SF Neighborhood Rent ChangeNotes: Figure shows amount of neighborhoods by percentage rent change over the span of Q4 2012 to Q1 2016
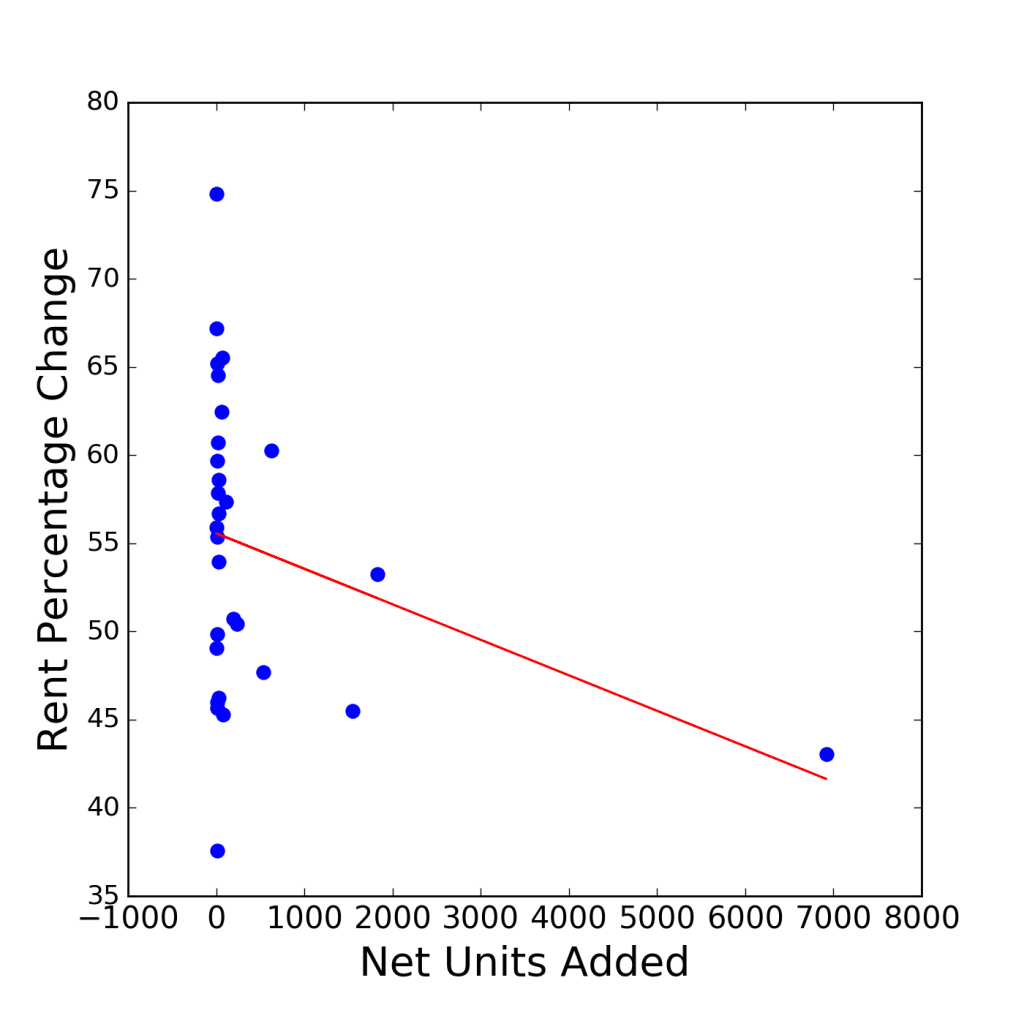
To get a more complete sense of how increasing units in the market impacted rent change, I estimate the correlation between net units built and percentage change in rent. In particular, I estimate a line of best fit between these two variables with the ordinary least squares method. The figure below shows this line. The line does have a negative slope, indicating that for every 1000 units produced prevents rent increasing by about 3-5 percentage points. However, it is difficult to trust the negative slope of the line. The result is heavily influenced by one outlier, SoMa, which can be seen in the lower right-hand corner of the plot. The r-squared of the estimate—or the measure of how much of the variance in rent change is explained by units built—is only -.06. This indicates that only approximately 6% of the change in rent can be explained by the amount of units produced. In sum, there does not appear to be any clear relationship between rent change and units produced.
Figure 4. – Rent Change Versus Units Added
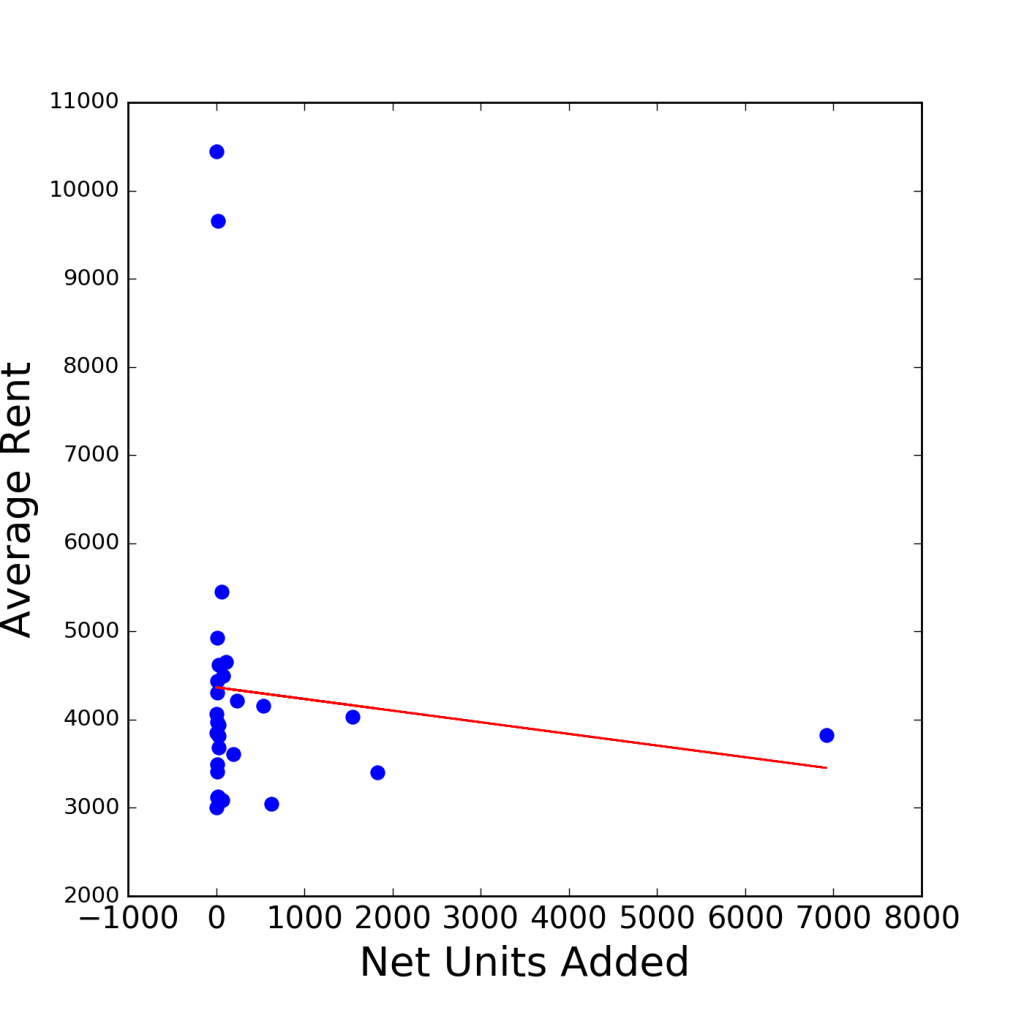
Lastly, I examine the relationship between average rent over the period Q4 2012 and Q1 2016 and net units produced. Perhaps wealthy neighborhoods with high property values restrict development through political influences on the zoning process and we can reveal this through correlations. In this case, the lint of best fit is also negatively sloped, indicating that a 1000 units increase in housing is associated with approximately 130 dollars less average rent. However, like the previous figure, it is difficult to give much weight to this result. The dots show that they are essentially uncorrelated with one another. In this instance the r squared is only -.026, indicating that about 3% of the variation in average rent can be explained by the amount of units built.
Figure 5. – Average Rent Versus Units Added
Yet, the fact that there is essentially no correlation in these two graphs is a result in itself. Although housing production has a clear impact on regional housing prices, the local impacts of increased supply are less clear. Getting to the bottom of this question requires data for a longer period, a more fine-grained geographic unit, and a complicated econometric model. There is no clear narrative one way or another, and that’s part of the reason that housing debates are so contentious.
Why Should Planners Care?
America’s cities are, for the most part, rapidly growing. In particularly high-demand areas like the Bay Area, this rapid growth is leading to rapid growing pains. With this development comes the need to build, but local zoning laws often confine the areas where that growth can happen. In fact, as we have seen above, the vast majority of growth can be concentrated in a very small portion of the city. This places a disproportionate share of the burdens of growth—crowded new developments, increased traffic, and tall new buildings—in certain neighborhoods.
It is no accident that neighborhoods like the Mission have been the poster child for gentrification in San Francisco. Yes, young professionals are attracted to the neighborhood because of its attractions, but the Mission is also one of the only places where new development is allowed. It’s time to shift some of the blame from gentrifying millennials to local planning decisions.
Furthermore, rapidly growing neighborhoods may not receive the benefits of increased housing supply with rent decreases. Although regions are clearly better of with increased housing supply on the whole, this makes little difference if the local benefits of development are ambiguous. Control over land use is local, and if cities don’t feel the benefits on the neighborhood-level, then urban areas will have a difficult time accommodating population growth with increased housing. Of course, we’ve already seen this with NIMBYs all across the U.S.
Moving Forward
I’m a firm believer that the first step in solving any issue is information gathering and sharing. That’s what I intend to do with this project and this blog moving forward. For tracking San Francisco development, I have set up a list of issues and future goals on the project’s github repository here. Items on the agenda include increasing user interactivity, increasing the time frame, exploring how current development relates to the existing housing stock, and, ultimately, gathering this data for other cities.
The housing debate starts with an honest, open dialogue and such a dialogue necessitates comprehensive and easy-to-access information. I hope that this project is a first step toward achieving that goal. Interactive maps of housing production might be useful not just for planners and developers, but also for neighborhood associations or residents interested in the broader context of regional housing development.
References
“2014 San Francsico Housing Inventory.” 2015. San Francisco Planning Department. http://www.sf-planning.org/ftp/files/publications_reports/2014_Housing_Inventory.pdf.
Chang-Tai, Hsieh, and Enrico Moretti. 2015. “Why Do Cities Matter? Local Growth and Aggregate Growth.” NBER Working Paper, no. No. 21154 (May). http://www.nber.org/papers/w21154.
Dineen, J. K. 2016. “In a Wealthy SF Neighborhood, Residents Fight Low-Income Housing.” San Francisco Chronicle. November 16. http://www.sfchronicle.com/bayarea/article/In-a-wealthy-SF-neighborhood-residents-fight-10617213.php.
Moretti, Enrico. 2013. “How to Make SF Housing More Affordable.” SFGate. http://www.sfgate.com/opinion/openforum/article/How-to-make-SF-housing-more-affordable-4590271.php.
“Regional Housing Need Plan: San Francisco Bay Area 2014-2022.” 2014. Association of Bay Area Governments. http://abag.ca.gov/files/ABAG_Final_RHNA_Publication.pdf.
“San Francisco Pipeline Report: Quarter 3 2014.” 2014. San Francsico Planning Department.
[1] In particular, I use the Zillow Rent Index (ZRI) Multifamily, SFR, Condo/Co-op time series found here.
Continuing the recent line of posts about SF residential development, I’ve finally decided to aggregate residential completions over the past 3 1/2 years rather than look at present development. While not surprising, the results are stark: SF housing additions are extremely concentrated in a handful of areas, particularly the South of Market area.
I have also used this post to experiment with the geopandas package in python. I am a complete novice and ran out of patience for some of the legends for these graphs, so apologies for their quirks. Hoping to update this post when I’m more experienced!
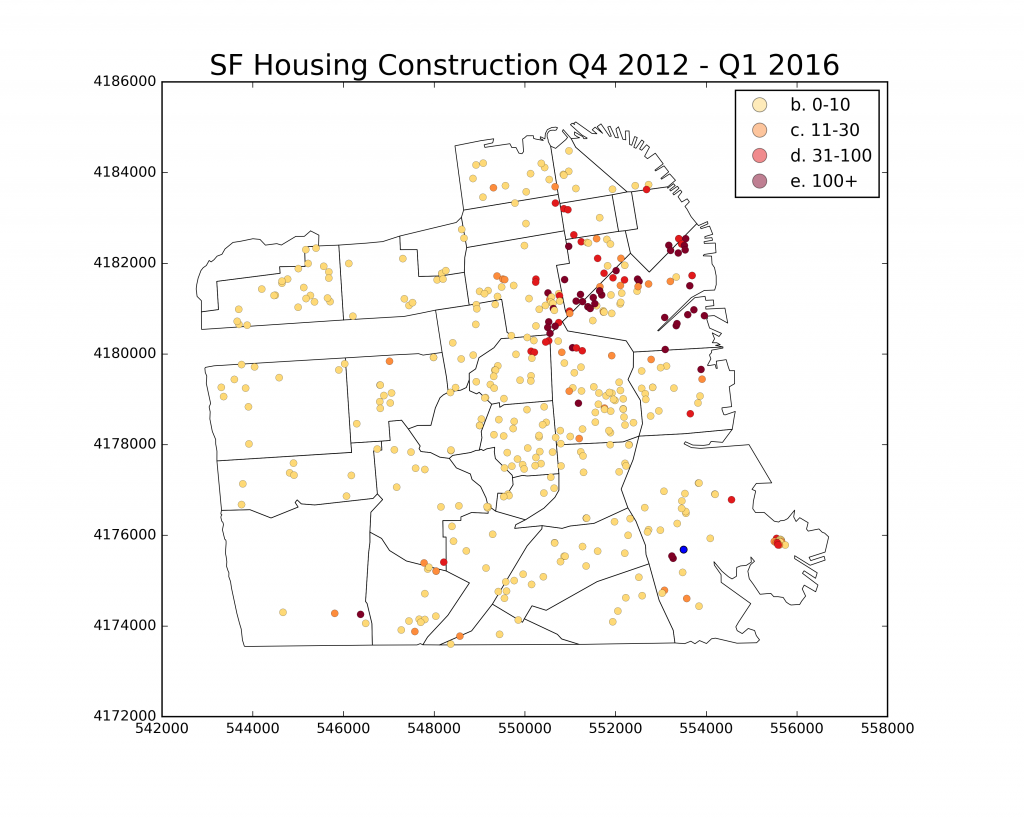
Onto the data…first, let’s plot dots of completed construction projects in the past 3 1/2 years. In particular, these are residential completions in the SF development pipeline from Q4 2012 – Q1 2016 because this is the only period for which there is consecutive data. The graph shows what we’ve seen in my previous posts of recent development: spread out, but with much larger developments on the eastern side of the city and, in particular, along the Market Street corridor. In anticipation for my next two maps, I overlay this data with neighborhood boundaries for San Francisco from Zillow. That one blue dot in Bayview has negative 1 units added. I sadly have not yet found a good way to integrate it into the legend.
Residential Development by Net Units Added
Next, the moment we’ve (read: I’ve) been waiting for… let’s aggregate by neighborhood! For those interested, I do this by performing a spatial join in geopandas between the two layers (both projected into UTM zone 10).
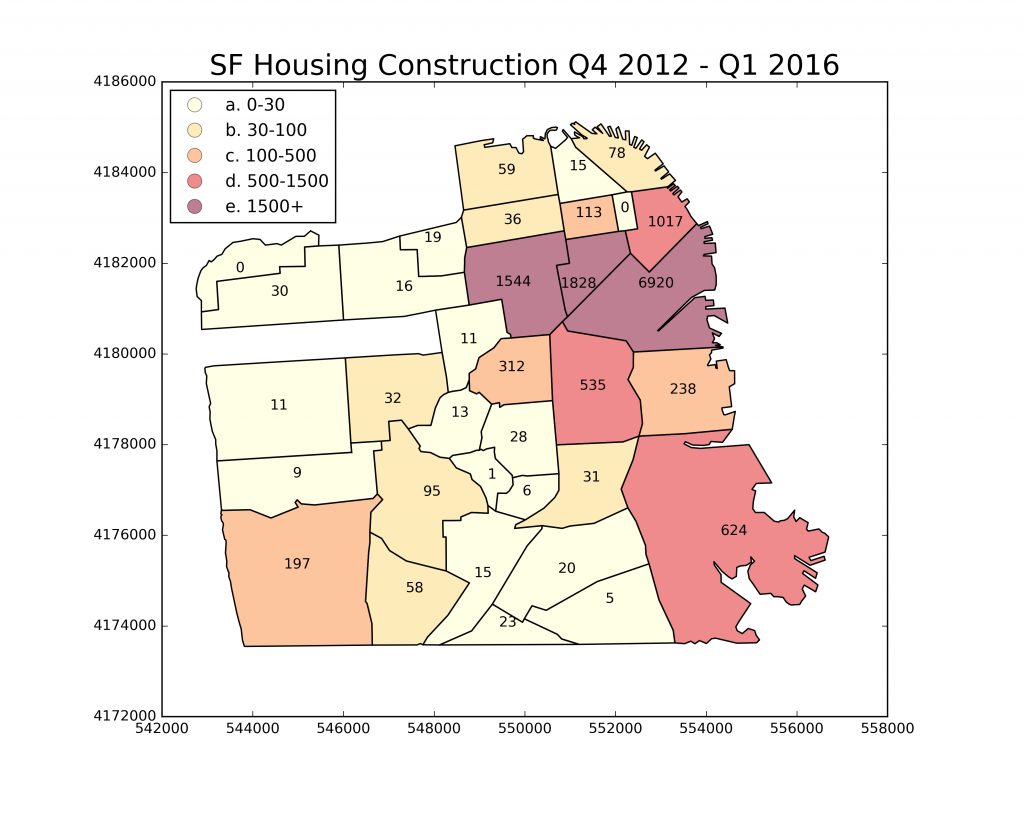
Net Units Added by Neighborhood
While not totally unexpected, the map is startling. Pretty much all of the residential additions in the past 3 1/2 years are on the eastern half of the city, and SoMa has added more than 3 times the amount of units as the nearest area. Moreover, areas like Richmond and the Sunset District have added less than 50 units each! Although the housing supply is growing with demand, not every area of the city is sharing this burden. It’s important to point out that this is due to deliberate zoning decisions made by the planning department in the past 10 years. However, behind every planning decision is tremendous political pressure from neighborhood associations and the like. This development pattern can ultimately be traced back to NIMBYs.
Finally, let’s look at affordable units by neighborhood.
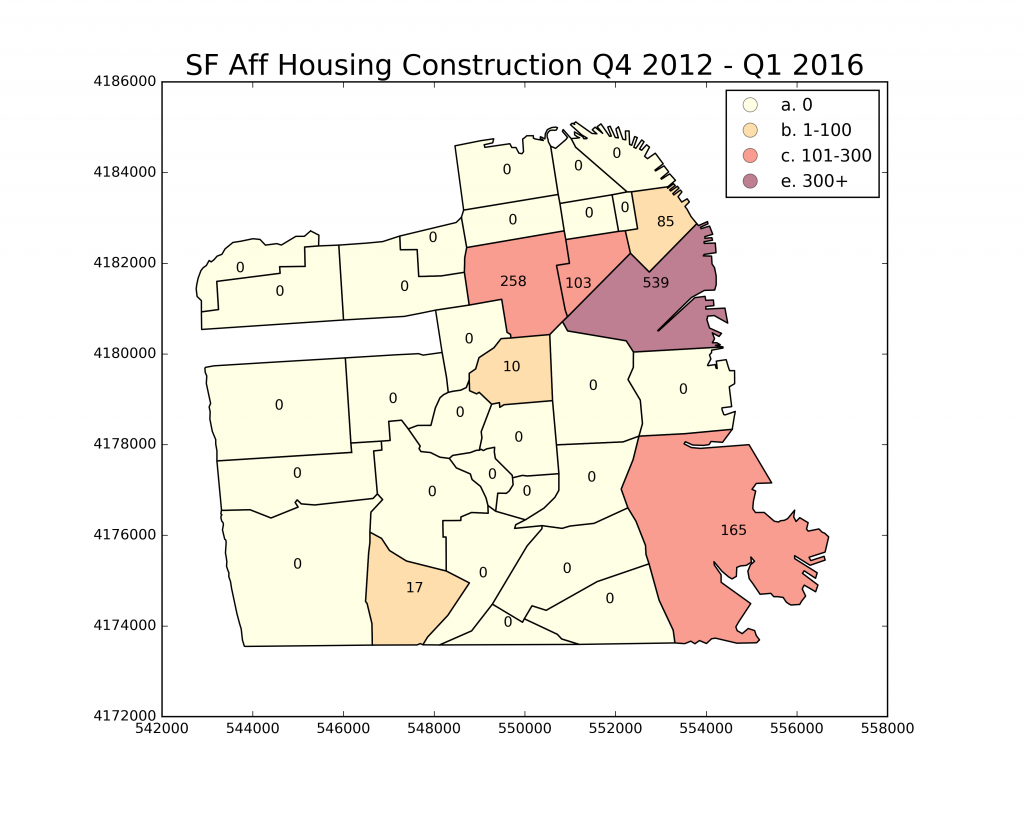
Net Affordable Units by Neighborhood
In general, the same areas building any units are the same ones building affordable units. But look at all the zeros! Clearly affordable housing is not an enticing prospect for most of the city. SoMa, I declare you the winner.
Following up on my post a few weeks ago about the state of current residential development in SF, I decided to focus more narrowly here. In particular, above I have mapped the residential developments that were completed in 2015, broken down by whether a development has affordable units or not. In technical terms, affordable units are defined as those for which rent equals 30% of income of a household with an income at or below 80% of San Francisco’s “fair market rent” (defined by HUD). In other words, they have some sort of rent ceiling. While I do not distinguish by number of units on the map, this information is available for each development by clicking on it.
Surprisingly, there are not many clear spatial patterns here. Development—both market rate and those with affordable units—appear to be fairly uniformly distributed throughout the city. In future posts, I hope to map this development for multiple years to explore the broader context of development.
Data comes from the 2015 Housing Inventory Report by the SF Planning Department.
For all of the talk surrounding the Bay Area’s housing crisis, I have found it difficult to understand not only the scale, but also the geography of the problem. Although we can get a decent sense of where development is happening via Census data on housing, this is at best polygons at the county or MSA level. The housing crisis is a problem at the most local levels of government. While the market would probably supply more housing if allowed, local land use controls at the municipal level have time and again blocked development.
So where can we find data on residential development at the municipal level? This is much harder than I initially thought. Most cities do seem to collect this information in their planning departments, but few have this information publicly available. One of the few planning departments that does publish such data is San Francisco’s. Through what’s known as their development pipeline reports, we can identify and map all development projects in the city that would add residential units or commercial space. This consists of all developments which have at least submitted applications to the planning department or department of building inspection. Furthermore, this data excludes projects that do not add residential units or commercial square footage (e.g. roofing upgrades). Within this data, we can group projects by different stages in the development process, such as planning review, building permit review, or construction. Furthermore, we have information on the number of net units added, which can be negative if a project adds less development than the previous residence had.
To start with, let’s take a look at a map of current projects by net units added. This data comes from the development pipeline’s second quarter 2016, which is the latest data available. For all intents and purposes, we can consider this the current state of new housing development in San Francisco.
A few notable points. First, the South of Market (SoMa) area stands out for both the overall quantity of development and the size (in terms of net units) of those developments. This has not gone unnoticed, as some have even called SoMa the “next phase of San Francisco’s urban history.” Second, the overwhelming majority of new residential development (over 80%) is less than 50 units. Although large luxury apartment buildings in SoMa may grab the headlines, these are definitely outliers in a city that is still mostly zoned for low density. Thirdly, there is a lot of development in low-density areas of the city (e.g. Richmond or the Sunset District) that have relatively restrictive zoning. People don’t seem to shy away from building there even if small developments are all that is allowed. Finally and perhaps most importantly, look how well the map above corresponds to a map of the zoning code! Pretty much all of the big developments seem to be outside of standard residential zoning.
Overall, the above points signal that the market is not the problem. At first glance, residential development seems to be happening fairly uniformly across the city. On the other hand, there is tremendous regulations as to how this development can take place. At least in terms of units per development, zoning is king.
As many in the city planning twittersphere may know, the Bay Area Rapid Transit (BART) system’s twitter account has, from time to time, engaged customers in lively debate. In one particular instance earlier this year, BART responded to customer complaints over track maintenance that the system has had an unpredictable rise in ridership coupled with a lack of investment.
Oh snap: Twitter fight
[ref]Screen shot taken from Upout.com (http://www.upout.com/blog/san-francisco-3/barts-twitter-account-getting-insanely-real-issues-lately)[/ref]
Leaving aside the state of BART’s infrastructure and investment, I want to take a closer look at BART’s ridership here. Exactly how much, and in which areas, has BART ridership increased? This simple exercise can help transportation planners determine both which stations serve the most people and where the ridership trends are heading. This, in turn, can serve as a metric to allocate limited resources. While this limited analysis does not fully answer these questions, it exposes some interesting trends to guide the inquiry, along with providing compelling evidence in favor of BART’s twitter defense.
First, let’s look at average weekday exits —defined as a single instance of a rider exiting a station—in 1999. I concentrate on weekday exits here because, anecdotally, workdays seem to generate the most customer frustration. While being late to a Sunday brunch is embarrassing, tardiness to a board meeting is probably worse. Furthermore, weekdays are when ridership is highest. As for 1999, this is the earliest year that I can find from BART’s weekday exit records. However, this works well because it roughly approximates the beginning of the tech boom mentioned in the twitter fight above.
Unsurprisingly, downtown San Francisco stands out as the single outlier on the map. While most stations in 1999 had around 5,000 exits per week, the Embarcadero and Montgomery stations downtown both had over 25,000. Also, the East Bay has fewer exits than the southern outskirts and of San Francisco—emphasizing that this area was the dominant commuting corridor at that time. The only exceptions to this are downtown Berkeley and the two downtown Oakland stations, all three of which had around 10,000 exits per week. This evidence certainly suggests that there was a relatively manageable set of heavily travelled stations. What does the map of 2016 exits look like, you ask?
Ridership grew almost everywhere throughout the system. Traditional heavyweights such as downtown San Francisco, Oakland, and Berkeley grew even bigger, with the top two stations—Embarcadero and Montgomery stations—now accounting for over 45,000 exits per weekday. Perhaps most importantly to the service quality of BART, the outskirts of major cities and suburbs grew sizably (with several new stations appearing). Not only could this put more strain on an aging system, but it also spreads track use over a wider area, making quality of service more and more difficult to maintain.
Finally, what do the numbers say in percentage terms?
Viewed through this lens, downtown San Francisco is far from king of the system. While there is still a wide gap in terms of absolute number of exits, Oakland, Berkeley, and the East Bay suburbs all equal or exceed SF in growth of ridership. Also, the outlying areas of the system are booming! More and more riders are taking longer rides, which surely puts strain on the system. Whoever is in charge of the BART twitter account was not lying. Riders may want to take it easier on a system that, built 60 years ago, has experienced dramatic growth in ridership over such a short period.
Data Sources and Decisions
Average weekday exit data by station comes from BART’s Ridership Reports page, found here. Additionally, geospatial data (kml file format) for the BART system comes from the BART website here. Unfortunately, matching on a string name variable was necessary to merge the geospatial data with the weekday exit data. There is a python script that includes a dictionary for this matching process at my github page here. In sum, I export a csv file with a crosswalk between the two datasets and then merge them within Carto. Also in the python script, I generate the percent change variable used in the above figures.
I made a number of data decisions within Carto during the mapping process. First, I chose a dark basemap and bright colors for the stations for contrast. I also made sure that the basemap’s labels do not overshadow the station points layer. In order to visualize the data, I chose a bubble map to compare an attribute—namely, station exits—of a points layer.
The BART station has expanded over the period 1999-2016, and the BART maps reflect this. I have purposely excluded stations that did not exist in 1999 from the 2016 map. One station, Warm Springs, is due to open in the Fall of 2016 and has been excluded from all maps. Although track expansions after 1999 are present on the 1999 map, I have decided to include the full extent of the present-day BART track system for two reasons: 1) the tracks layer is not split up into expansions, which makes it impossible to drop the expansion portions without dropping the whole system 2) I felt that the tracks were illustrative of the expanse and direction of the present-day BART system, reinforcing my overall point about BART’s enormous growth.
As for the bubble maps, I decided to use equal interval sizes for the bubbles. This is mainly because it easier for the reader to understand. Furthermore, the data in percentage terms is fairly uniformly distributed while the exit maps in absolute numbers have large outliers, which would be lumped together with much smaller stations in some other distribution.
Finally, I decided to label stations because I mention some specific stations in the article. Also, some of my readers might be unfamiliar with the BART system. However, labels would clutter the map at first glance, so I have them only appear at a specified zoom level.