This blog post is a shortened version of a longer academic paper. You can find the latest draft of the full paper here.
I. Introduction
Housing developments in San Francisco often endure long and dramatic battles between the public, developers, and the city itself. Yet, for all of the discussion around these battles, there does not exist any comprehensive accounting of just how long the housing development process is. This information is critical for either policy makers considering how to better streamline development review or developers considering the feasibility of a certain site. In this post, I’d like to introduce some preliminary data exploration on development times in San Francisco. Specifically, I have estimated the time it has taken housing developments completed in the recent past (mid 2009 to the first quarter of 2017) to reach completion after submitting their planning or building permit applications.
In order to do this, I appended quarterly datasets known as the development pipeline reports from the San Francisco Planning Department. These datasets are meant to be cross-sectional, but contain other helpful information such as the date a project was first filed. With this information, I transformed the multiple pipeline datasets into one project-level dataset of development timelines in the recent past. In this process, I had to make a few assumptions about development timelines—notably, I assume that a project is completed on the first date of the quarter when it “disappears” (i.e. is not present in) from the pipeline reports after being under a status of “construction” in the previous report. This means that the completion date is accurate within 3 months of the actual completion date. Note that these estimates also only measure the time from official application submission to completion, so do not take into account any preliminary review time, such as preliminary project proposals or community meetings prior to their official application.
Without further ado, I’d like to give a broad overview of what the data says. If you’re interested in the process to create this data, you can find the code on Github here.
II. Housing Development Time Overview
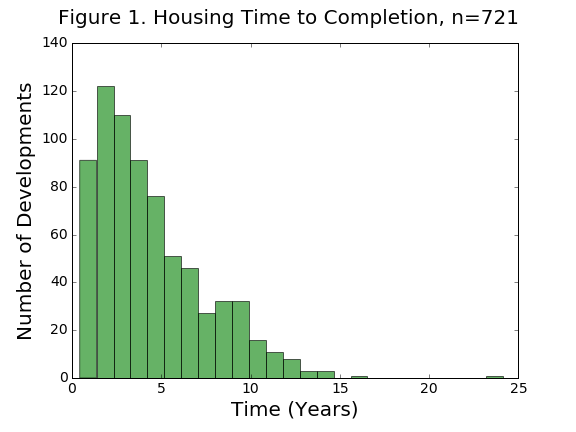
For the purposes of this post, I say development “time to completion” to mean the time from the point of submission of a building or planning entitlement application to the completion of the project. After some data cleaning (filtering out housing developments with duplicate building permits, etc.) we’re left with 1,147 housing developments between Q3 2009 and Q1 2017 that have completed at least one stage of the development process. Of these, 721 reached completion. Figure 1 shows the distribution of these projects by time to completion in years. The median development time for these housing projects is about 3.8 years—meaning over half reached completion within 4 years of submitting applications. Despite this, there are a sizable amount of projects that take more than 10 years—the maximum taking 24 years.
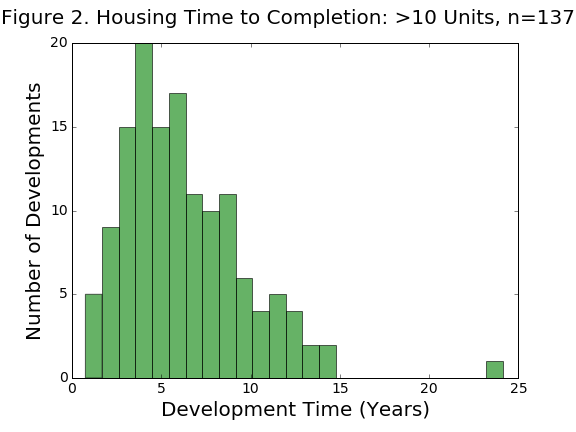
The bunching below 5 years in this histogram is partially because this includes all housing developments without regard to their unit count. As a result, there are many 1-2 unit projects below the 5 year point and many multifamily apartment buildings—the majority of unit additions in the city—above 5. Instead, we can normalize this measure by dividing the project development time by the amount of units added by the development. Instead, Figure 2 below shows a histogram of time to completion for housing developments that included 10 or more new units. These projects have a much greater median time to completion of about 6 years.
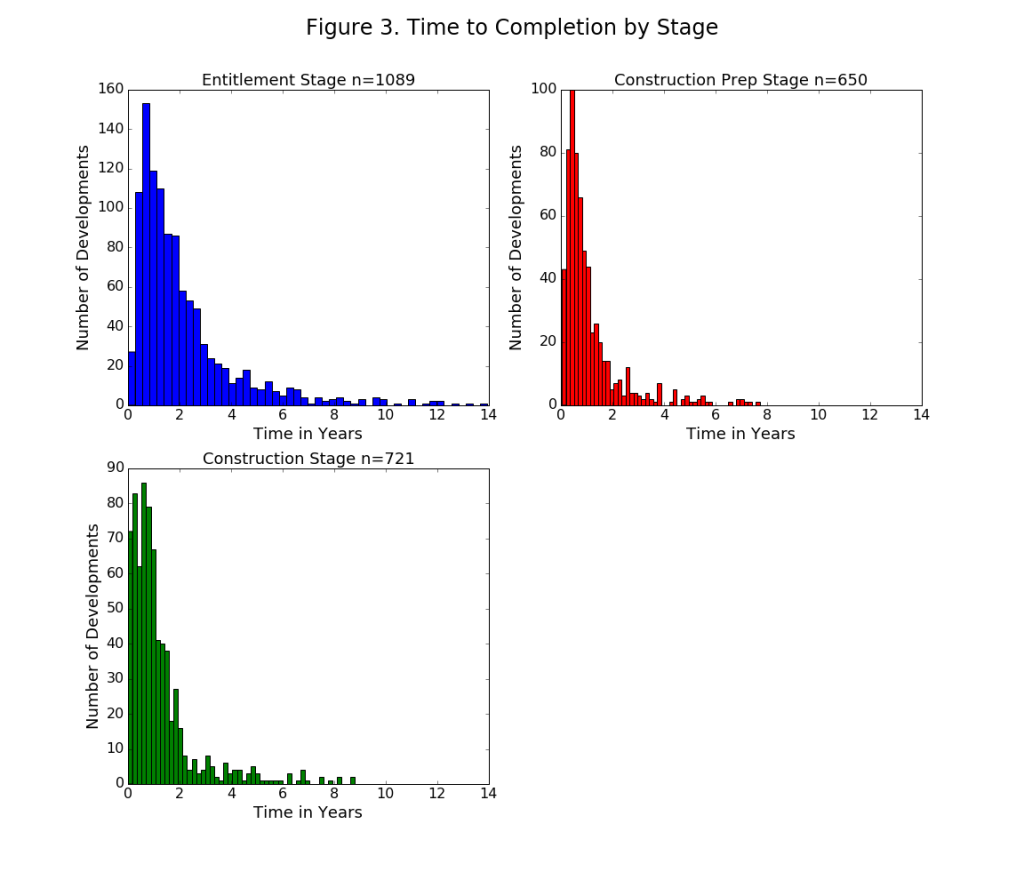
In addition to total time to completion, we can measure three separate stages of the development process with this data: 1) the entitlement stage, or the time from submission of planning or building permit application to receipt of building permits 2) what I call the “construction prep stage”, or the time between receipt of planning and building entitlements and the start of construction and 3) the construction stage. Figure 3 contains histograms for the lengths of all three project stages and contains varying sample sizes depending on how many projects contain this information. The figure shows that the entitlement stages tends to be the longest stage and also has the most variation between developments. While most construction prep and construction stages are less than 2 years, entitlement stages are oftentimes much longer—between 2 to 4 years or more.
III. Variation in Development Times by Project Size, Neighborhood
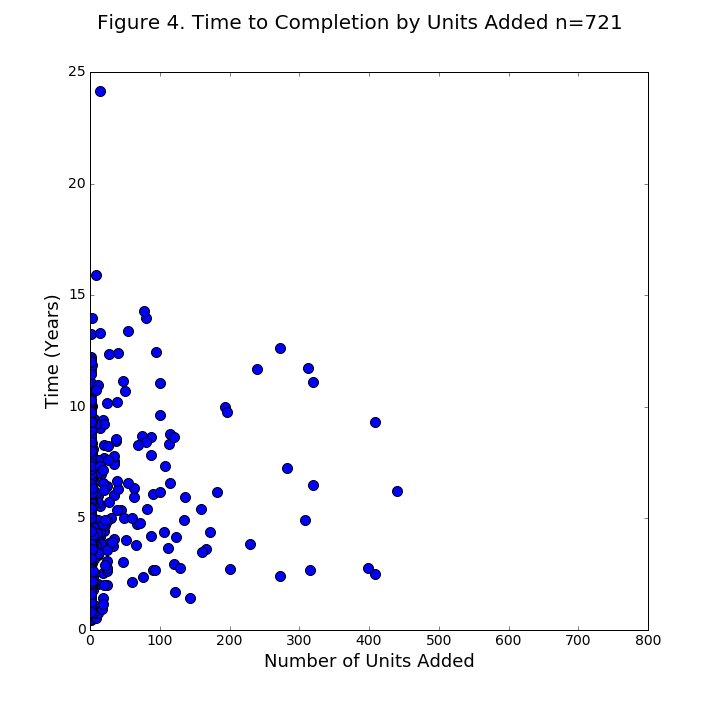
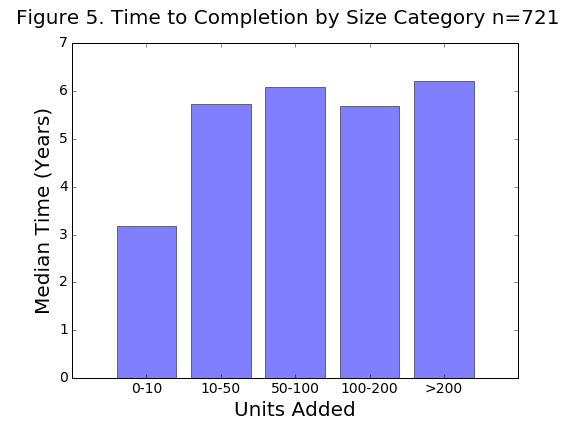
What could explain the variation in times to completion shown in the figures above? It’s easy to think of a few factors, most notably the size of the development. Figure 4 draws a scatter plot of total time to completion against the numbers of units added. There is some but no significant positive correlation between units and development time. In order to explore this further, I break down median time to completion by some common unit-size categories in Figures 5 and 6. As expected, small developments (those with 1-10 units) have the shortest completion times. However, these developments make up the vast majority (about 75%) of housing developments completed over this time period. Furthermore, very large projects (more than 200 units) take the longest at just over 6 years.
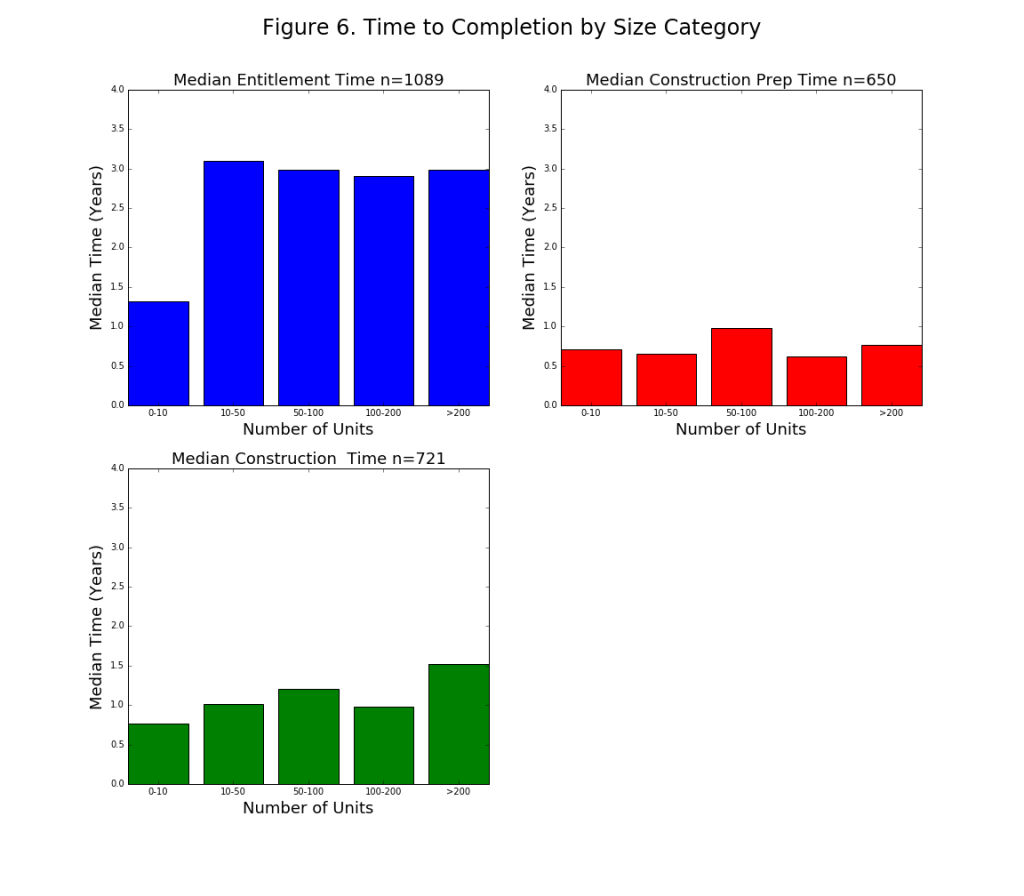
Interestingly, projects adding between 50-200 units take less time than those adding between 10-50 units. Perhaps this is because 50-200 unit projects are closer to downtown areas—where neighborhood opposition is less fierce—than 10-50 unit projects. Figure 6 breaks down development time by unit-size categories into the 3 stages of the development process. Again, most variation in review time comes from the entitlement process. Interestingly, the longer entitlement phase for mid-sized 10-50 unit projects makes up for the fact that larger developments take longer in the post-entitlement stages.
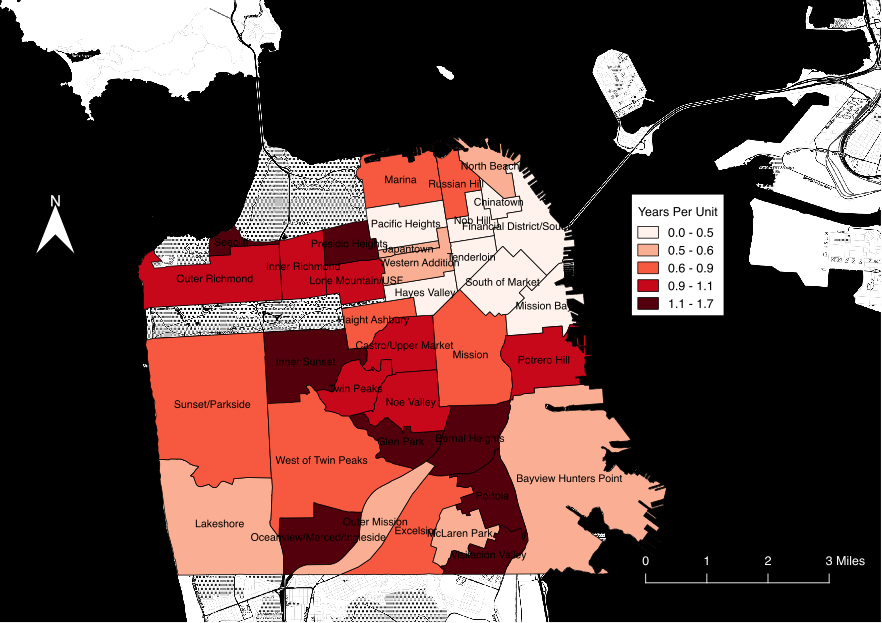
 Finally, I explore differences between neighborhoods. For Figures 7 and 8 below, I use the 41 neighborhoods created by the Planning Department. Because some neighborhoods only get small housing developments while others only get very large developments, I normalize time to completion by dividing by units added. For these graphs, I also drop neighborhoods that have less than 10 developments in the sample. The results point to a clear pattern: when we divide time to completion by unit size, lower-density neighborhoods—such as Twin Peaks, Bernal Heights, or the Richmond District—outside of the core of the city have both larger total time to completion and entitlement review times. Conversely, most of the highest-density neighborhoods—places that have also seen the most development, such as Soma, Mission Bay, or Hayes Valley—have the shortest review times. Figures 9 and 10 show these results on the map.
These results emphasize an important point: despite much smaller development in outlying neighborhoods, the city spends just as much time reviewing developments in those areas. However, these developments have much less impact on the surrounding environment, and so likely do not merit commensurate review time as large apartment buildings near downtown. These results suggest that the city could have a large impact on housing streamlining by reducing the scrutiny on small to mid-sized developments. This would also likely conserve limited city resources.
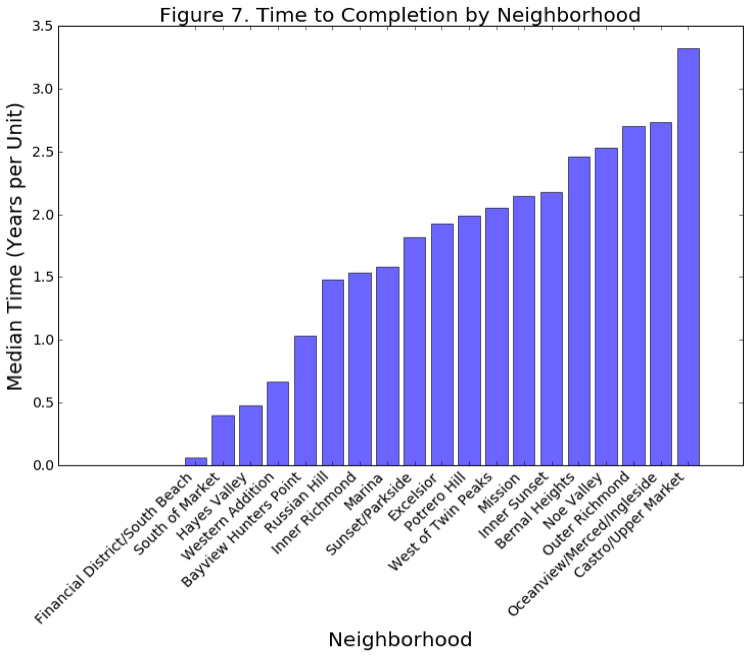
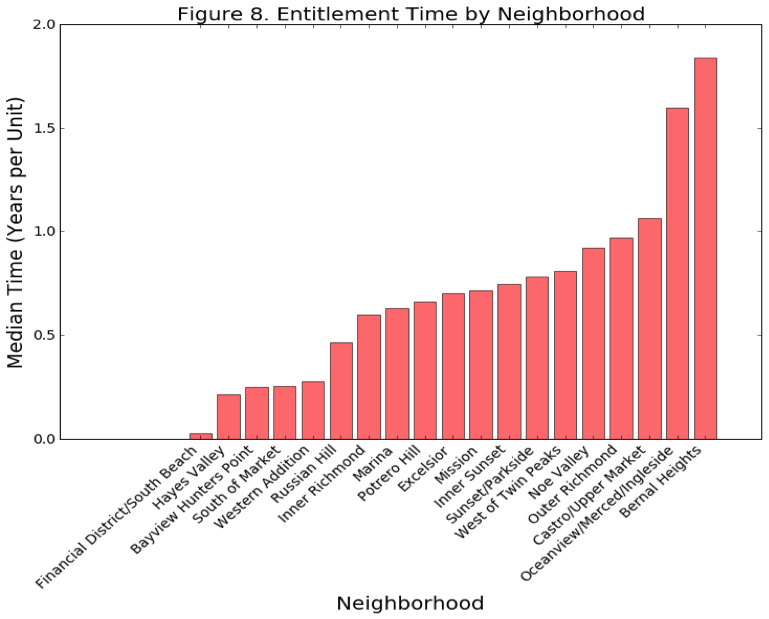
Figure 9. Housing Time to Completion by Neighborhood
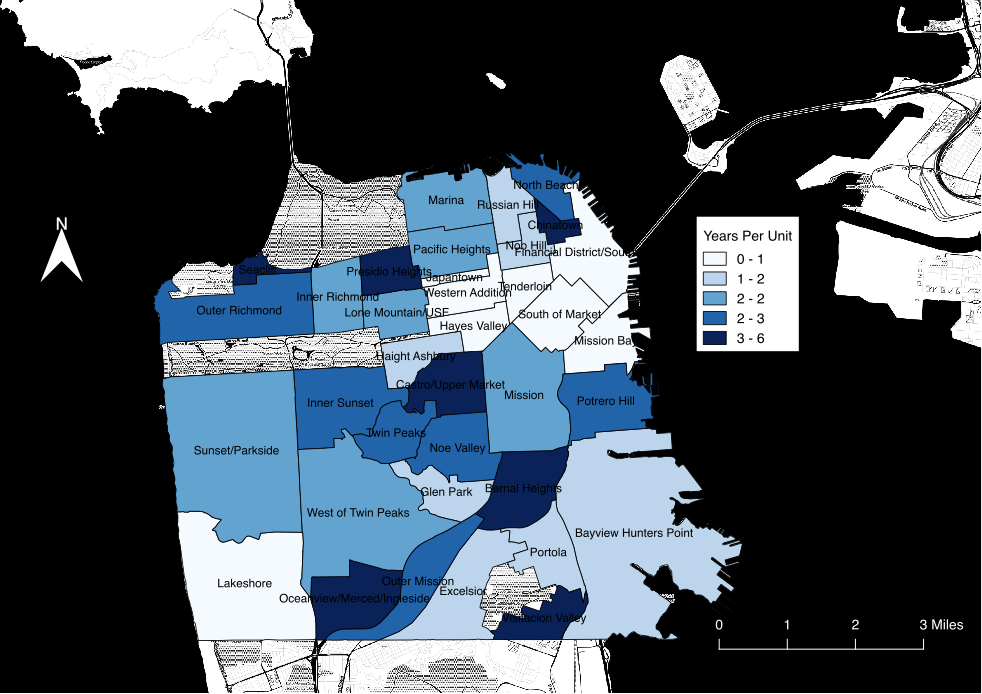
Figure 10. Housing Entitlement Time by Neighborhood
IV. Conclusion
I hope that this exercise has shown the potential benefit for local governments to collect data on the housing development process. Unfortunately, cities rarely maintain data on housing production at all, let alone the time it takes to create housing. In this example, we have learned not only how long developments take on average, but also how size and location impact review times. Armed with this knowledge, the data suggests some key areas of improvement in the housing review process.
First, both the longest stage of the housing development process and the stage with the most variation is the entitlement review process. This variation suggests that it has the most potential for delay or expedition of developments. Considering this, Mayor Ed Lee’s executive directive to streamline housing review definitely appears to target the correct part of the housing development process. Second, despite being smaller, mid-sized developments in low-density areas appear to have just as long development review times as larger apartment buildings. This signals that the development review process is at least somewhat misaligned, as the city could be saving time reviewing these projects and instead allocating this time to larger, more disruptive projects. Furthermore, this misallocation of priorities likely has a large impact on housing affordability, as mid-sized developments are likely to be more affordable than large apartment buildings, which are more costly and so demand top market rents.
Unfortunately, I cannot say from this analysis exactly why mid-sized developments have the such long review times. However, many of these projects are in low-density areas that are either 1) subject to more neighborhood resistance or 2) are not within specific plan areas, which qualify for streamlined environmental review. Unfortunately, the Mayor’s process streamlining directive does neither of these things, instead focusing speeding up internal procedures without reducing requirements. Disgruntled community members can appeal and delay projects no matter how hardworking and efficient the review process is. Instead, a more politically difficult but effective policy requires reducing regulatory requirements themselves, such as the amount of discretionary review for small projects. For example, the city could consider creating more specific area plans in outlying neighborhoods so that small projects in these areas would be subject to much less environmental review.